Dashboard
Dashboard
Updated March 15, 2026
Overview
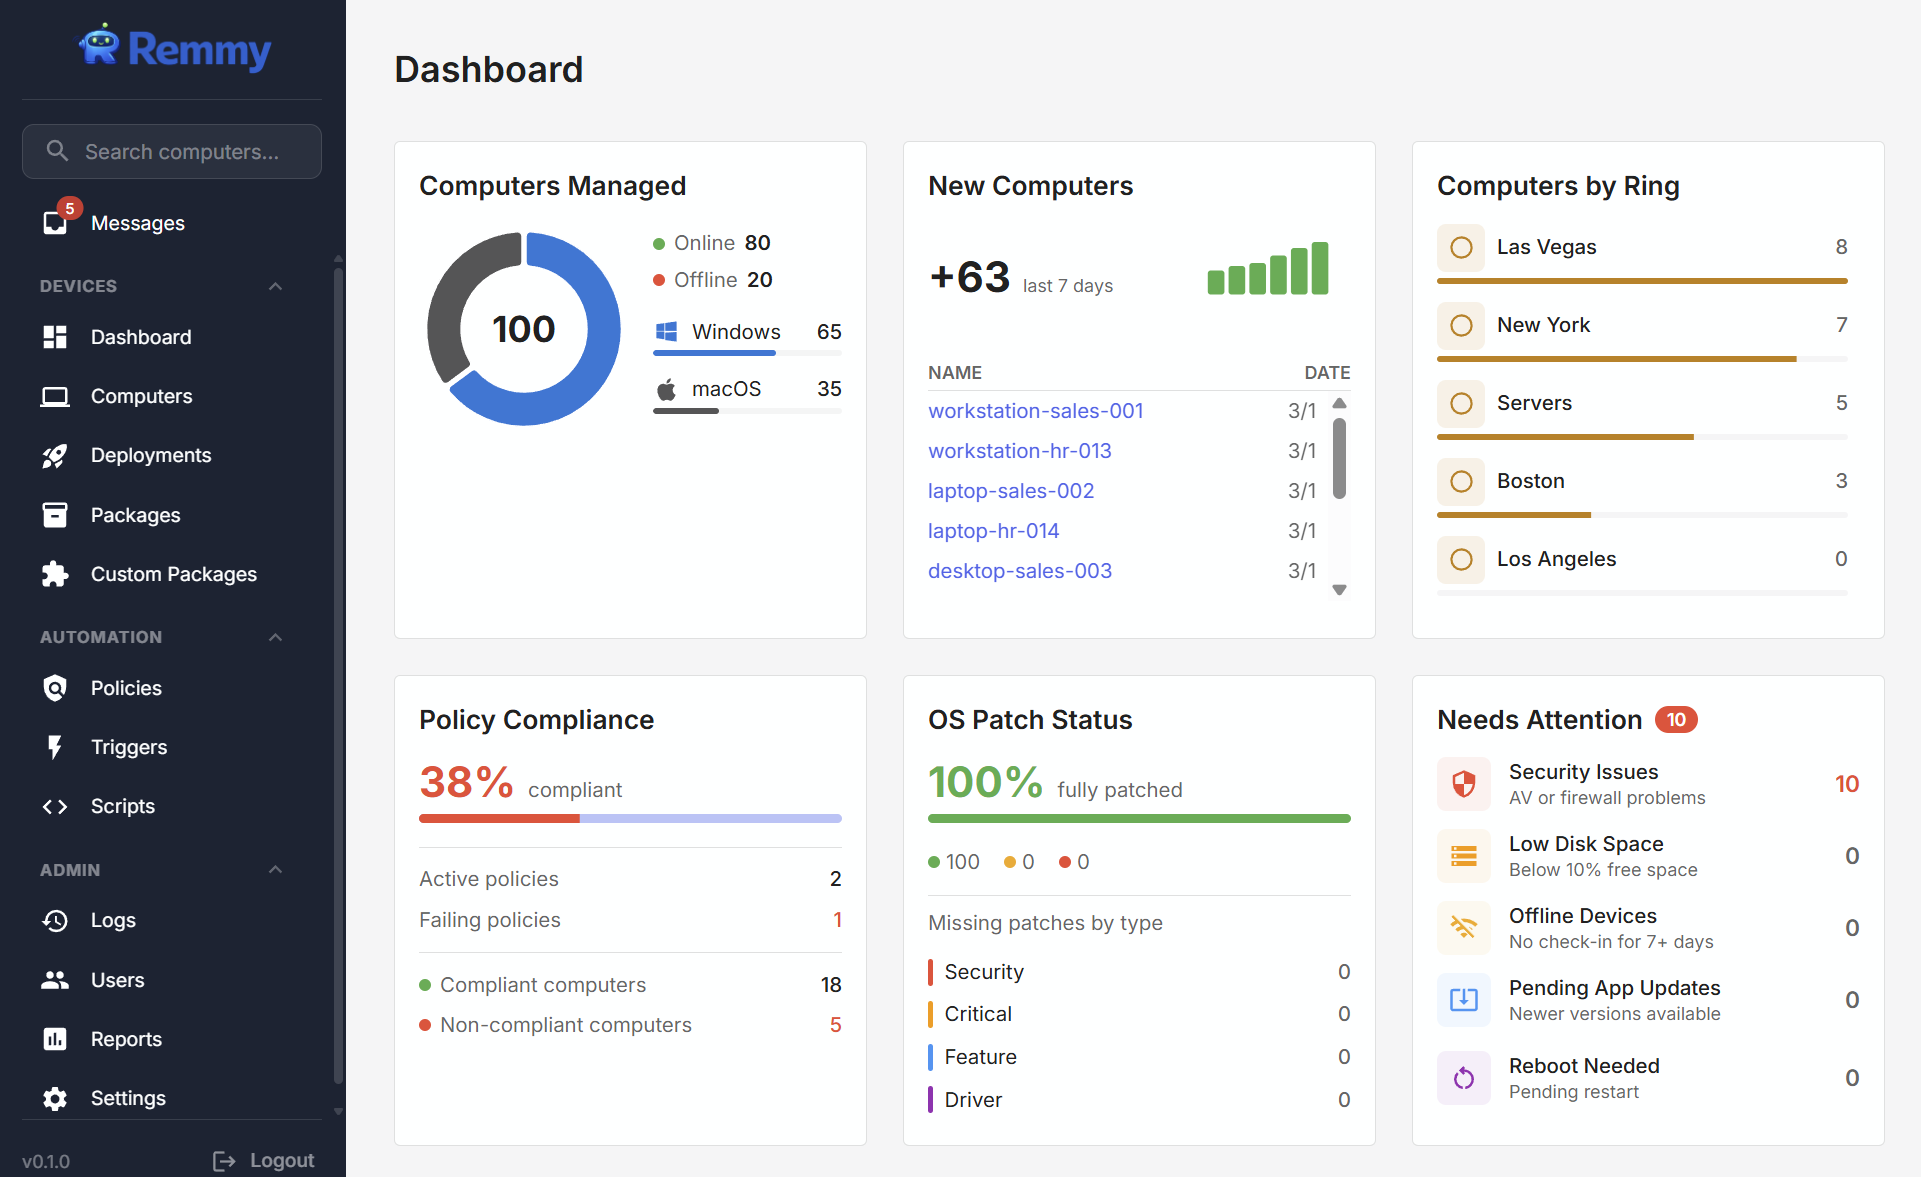
The dashboard gives sysadmins an at-a-glance overview of the managed computers, deployment activity, compliance status, and items that need attention. The dashboard is the default landing page after logging into the Remmy server.
Editing dashboard
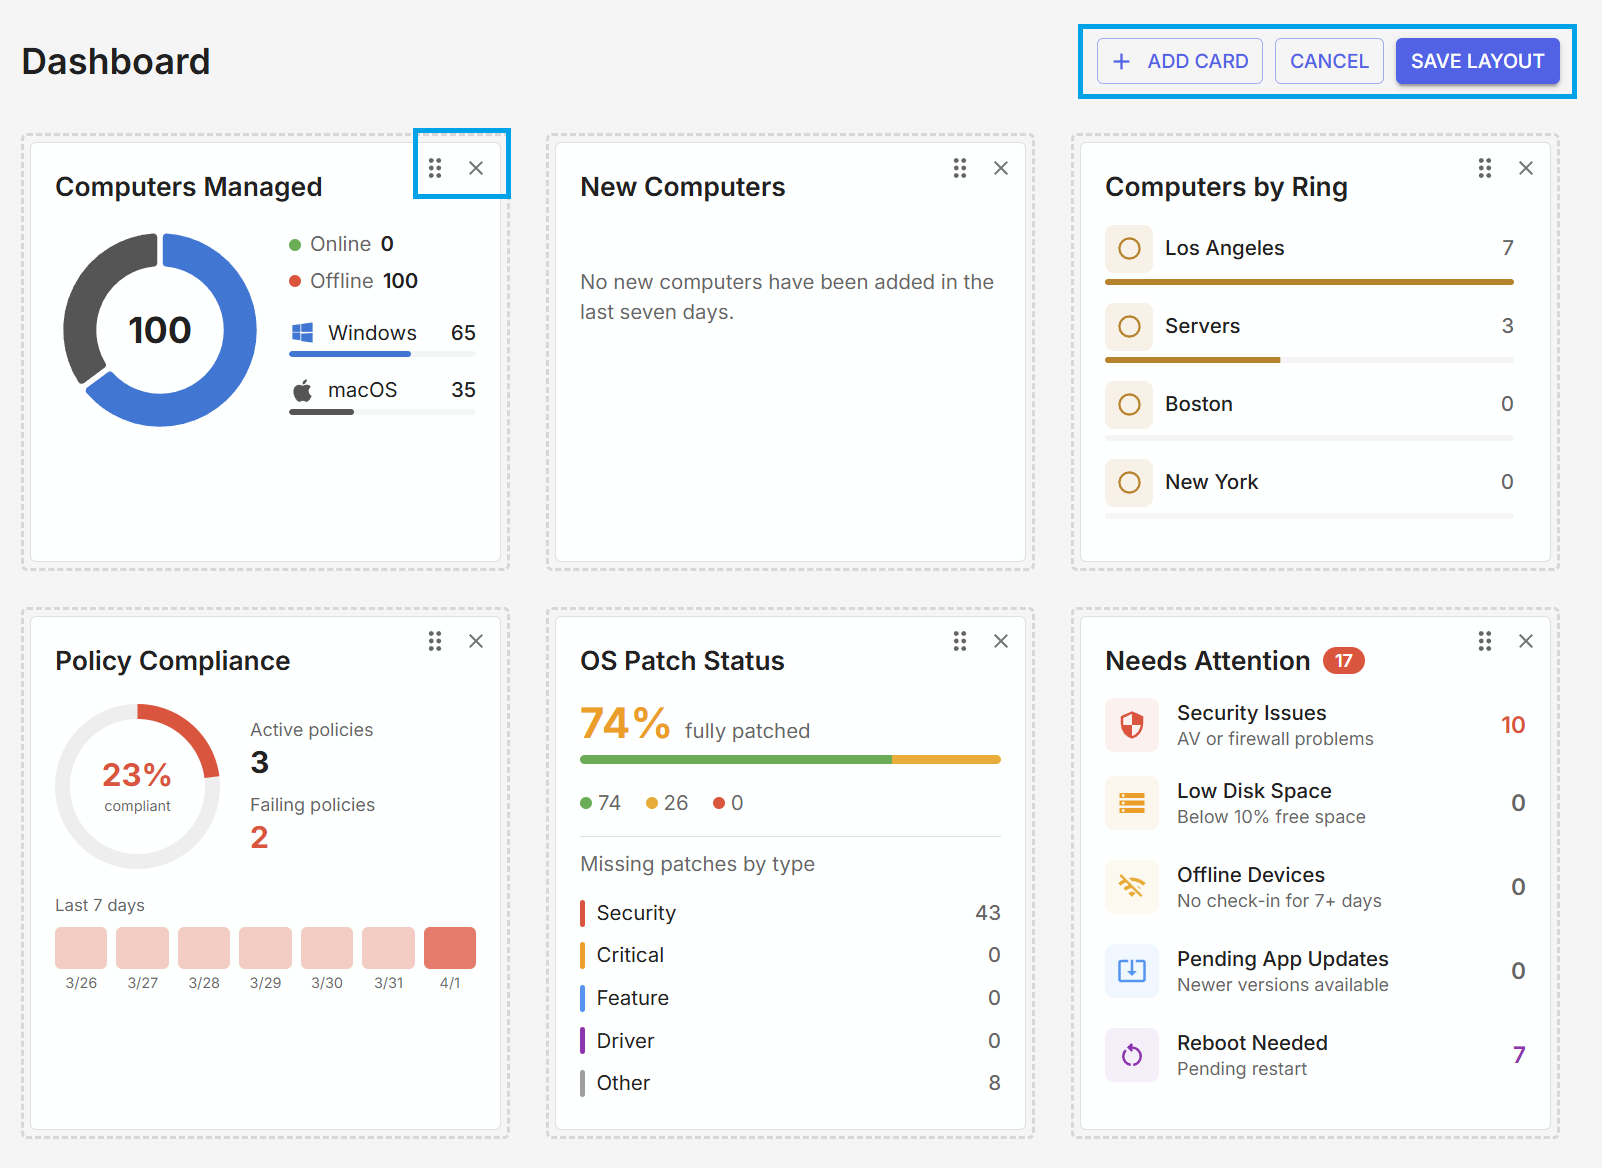
Users can adjust which tiles are shown in the dashboard and set the order the tiles are displayed. This is a per-user setting, enabling individual sysadmins to configure the dashboard to their personal preference and role.
To adjust the dashboard tiles, a sysadmin clicks the edit button on the top right while viewing the dashboard. Sysadmins can remove tiles by clicking the X, add tiles using the drop-down, or drag and drop to relocate different tiles.
Dashboard tiles
| Tile | Description |
|---|---|
| Computers Managed | Total computer count broken down by operating system, with online vs. offline status. |
| New Computers | Computers added in the last 7 days, with a daily bar chart and recent registrations. |
| Computers by Ring | Computer rings sorted by count, showing the relative size of each ring. |
| Policy Compliance | Overall policy compliance percentage with counts of active policies, failing policies, and compliant vs. non-compliant computers. |
| OS Patch Status | Percentage of fleet fully patched, partially patched, or unpatched, with a breakdown of missing patches by type. |
| Needs Attention | Surfaces computers that may need intervention, including security issues, low disk space, offline computers, pending app updates, and reboot needed. |
| Deployments | A 7-day bar chart showing how many software deployments were created each day. |
| Deployment Activity | A heatmap showing deployment activity over the last 35 days. |
| Top Packages | The 4 most frequently deployed packages over the last 7 days. |